
Nike Is Still Not a Buy: Fundamental & Technical Analysis
In this post, Capitalist Letters and & My Weekly Stock collaborate to make a strong bear case on Nike.


This is a collaboration between Capitalist Letters and My Weekly Stock to bring you both fundamental and technical insight into Nike. We hope you enjoy it and if you like this post please subscribe to our publications for more!


So, let’s cut the BS and dive deep into Nike!
Nike: Strong Brand & Broken Operations
I am sure most of you guys grew up by looking at and envying the shoes of Jordan, Kobe, Lebron, Ronaldinho, Ronaldo and many others…
Though they were fundamentally different, they had one common point: They all wore Nike.
Its swoosh and motto “Just do it” always called for top level performance. I remember wearing my first Niker soccer shoes. Though nothing had changed in my talents, I had suddenly felt more confident because I now had something in common with those great athletes.
In my childhood, it was unimaginable to pay Nike price for something that was not Nike. If an alternative brand was selling for $90 and Nike for $100, you would buy Nike. No exceptions.
This dynamic seems to have broken recently.
There are few reasons for that.
First, we have many more heroes now. In the past celebrity status was exclusive to Hollywood stars, top athletes and famous music stars. But now we have influencers. They are celebrities in their audiences so they have the ability to make or kill a product, brand or a service.
Boom of influencers combined with ease of outsourcing manufacturing from China gave rise to many new lifestyle businesses, a type of business set up and run by its founders primarily with the aim of living or maintaining a certain lifestyle.
Naturally, those lifestyle businesses appeal to audiences that have similar lifestyles. Influencers that pioneer those lifestyles usually lead those audiences.
Influencers commercialize their influence mainly in two ways: Either they create the business themselves, or they create sponsored content for those businesses. The initial revenue generated from the influencer's audience allows the company to at least survive. Then, from here, they can expand to neighboring lifestyles and markets.
Aggregation of those businesses creates significant competitive pressure on legacy brands like Nike. Brand status is not as advantageous as it used to be because your local influencer wearing an unheard brand instantly creates enough social proof to give it at least a shot.
Moreover, the connection between the influencer promoting a lifestyle brand and a follower is much stronger than the one between a Nike athlete and a Nike customer. This creates an interesting phenomenon: Those lifestyle brands can charge premium over mass brands like Nike.
Nike also responds by hiking prices but there is a limit on the premium those mass brands can charge without losing customers. This pushes brands like Nike to cut production costs to keep the gross margins competitive.
Efforts to cut production costs create the second problem: Deteriorating quality.
I have always been a big buyer of Nike, though I don’t believe the quality is the same. You can see people reporting the declining quality of Nike shoes in masses.
Increasing number of original Nike shoes come out of the box with production defects and consumers report that they can now wear an average Nike shoe for at most 2 years. This was close to 5 years in the past.
I personally think the last great shoe Nike made was Kobe VII.
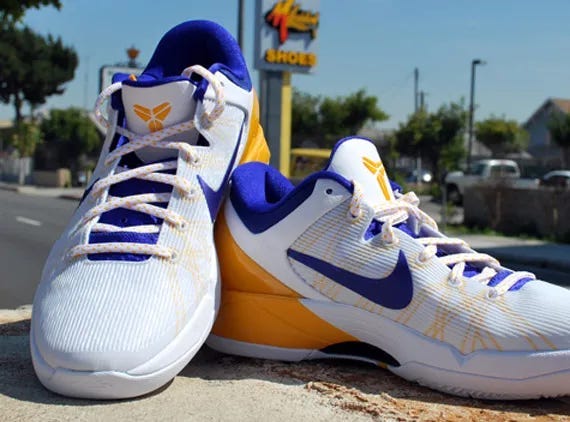
It came out in 2011 and I remember buying them at a discount in 2012. Quality was exceptional. It has been 12 years but I still wear them and there is no sign that I won’t be wearing them next year.
Does this mean that the brand is no good anymore? Of course not.
Nike still has an exceptional brand but its ability to turn the brand power into revenue has declined. This is an operational problem. It has to figure out a way to penetrate into the strongly knit lifestyle communities and stop those smaller businesses eating its cake.
Is this impossible? No.
Do I see it happening soon? No.
📊Fundamental Analysis
➡️ Business Performance
If I was to reduce Nike’s performance in the last 5 years into one word, I would say “disappointment.”
Revenue grew from $39.1 billion in 2019 to $51.2 billion in 2023, 7.1% average annual growth rate.
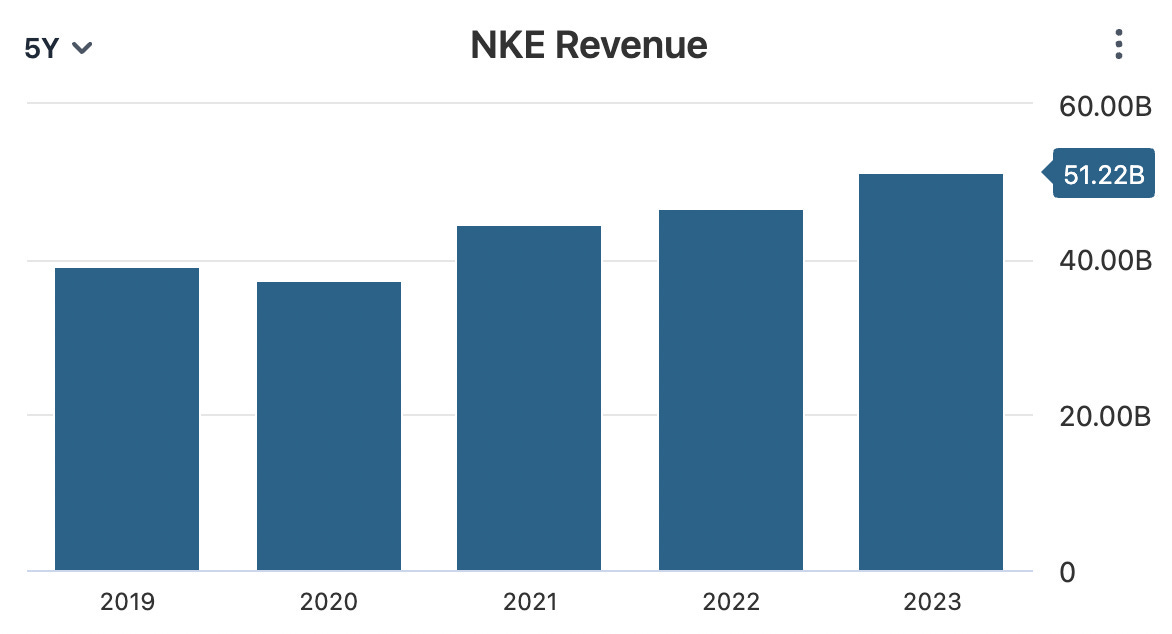
This is extremely concerning to me. Why? It’s simple. Take high inflation into account.
In most of 2022 and 2023, inflation in the US was close to 40 year high. When you account for inflation, Nike’s real top line growth is closer to 5% annually. Given that the company raised its prices more than inflation, we can infer that Nike failed to create any new demand in the last 5 years or so.
Its grip over the basketball shoes market is strong as it has over 80% market share. However, the rest of the sneaker business and apparel don’t perform as well. This is where Nike is losing to brands like LuLuLemon and the lifestyle business.
It has to penetrate into the tribes around the influencers but has failed to do this so far and I don’t see any reason this will change soon.
Aside from stagnant top-line, Nike’s operational efficiency has significantly deteriorated in the last 3 years.
Revenue grew 15% from 2021 to 2023 while operating expenses increased 25% in the same period. As a result, Nike generated less net income in 2023 than 2021 despite generating $7 billion more revenue.
I don’t know about you but I don’t want to invest in a business with less efficient operations while AI applications are actually increasing the productivity and efficiency across the board.
➡️ Financials
Nike’s financials are still strong as you would expect from a brand with its size and recognition.
It expanded its equity pool by 50% since 2019. After the Fed started hiking interest rates in 2022, it prudently added on its equity pool to make it larger than its debt load.
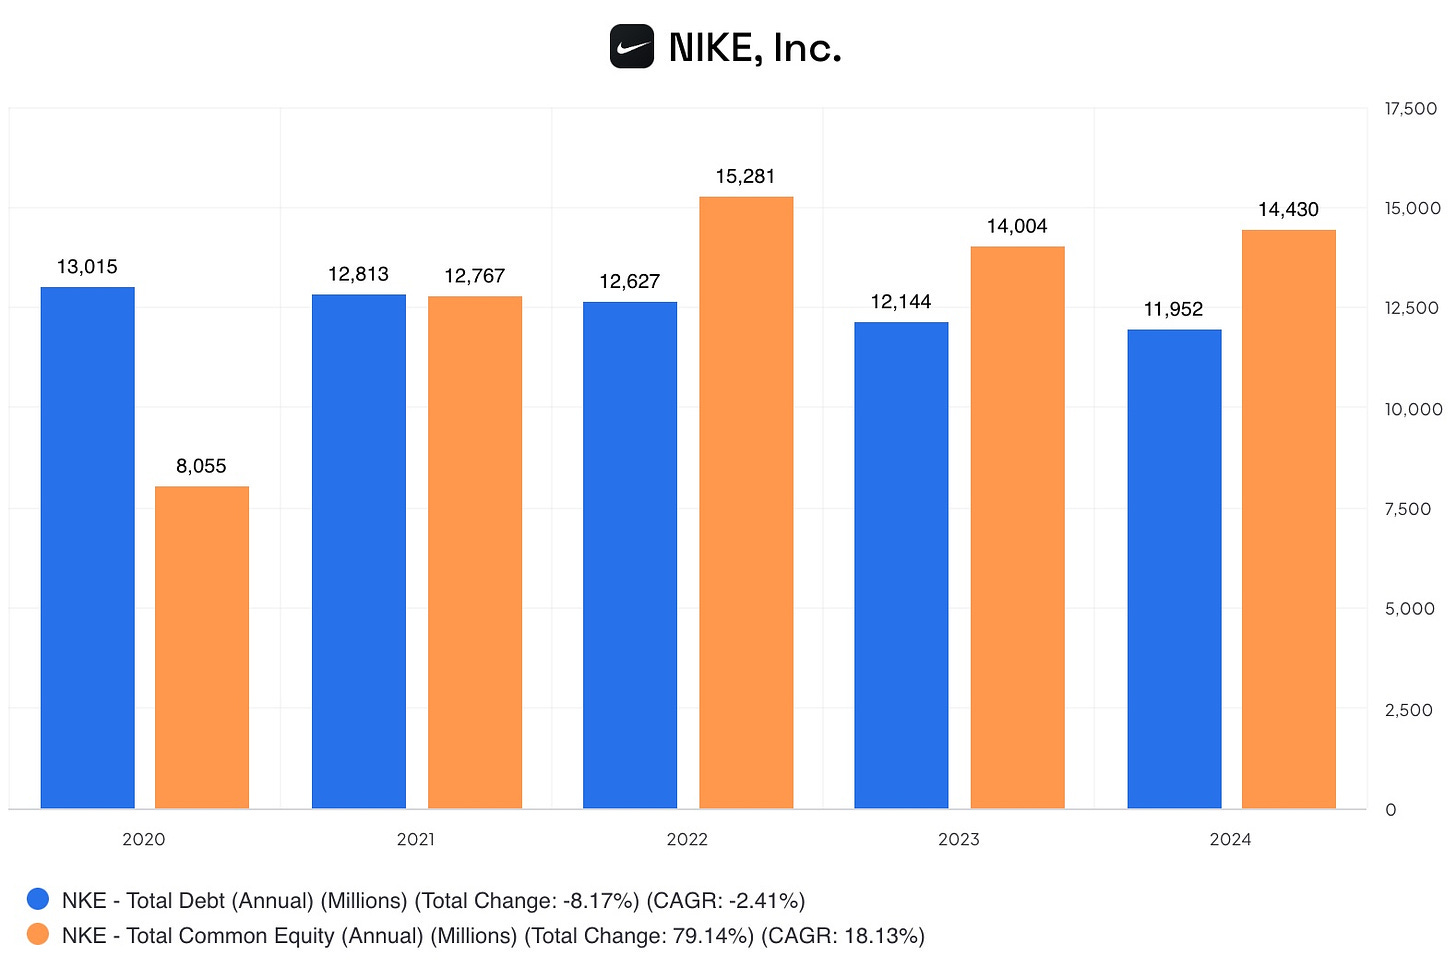
Its earning power is also strong enough to cover liabilities without reaching its equity pool. In the last twelve months, it generated $6 billion in EBIT. At this earning rate, it can pay down all the debt in just under two years.
Balance sheet is what I like most about Nike. If it's going to resolve operational problems and back to top-line growth, the balance sheet is well prepared to support this.
➡️ Efficiency & Profitability
Gross Margin
Nike actually has a very stable gross margin.
In the last 5 years, its gross margin swung between 43.42% and 45.98%.
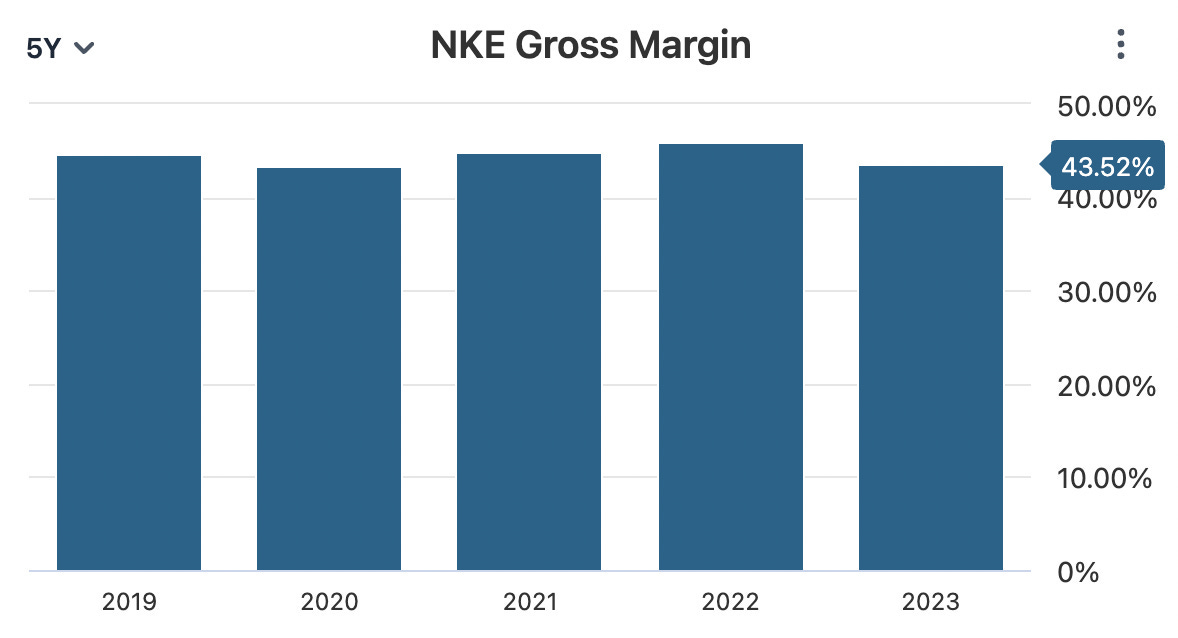
I would actually be very happy to see this as an investor if it was combined with satisfactory top line growth. In that case, I would think that the business is growing without feeling much competitive pressure.
However, given that consistent gross margin is not accompanied by growth, I now infer that the business reached a price point of which it can’t go beyond without losing customers.
In this case, you expect the business to find new markets or new products to ignite growth. This is the management’s responsibility and I haven’t seen it doing this so far.
Operating Margin
Operating margin indicates a business' ability to translate revenue into net income. Higher the operating margin, more efficient the operation is.
In Nike’s case, we see a declining operating margin since 2021
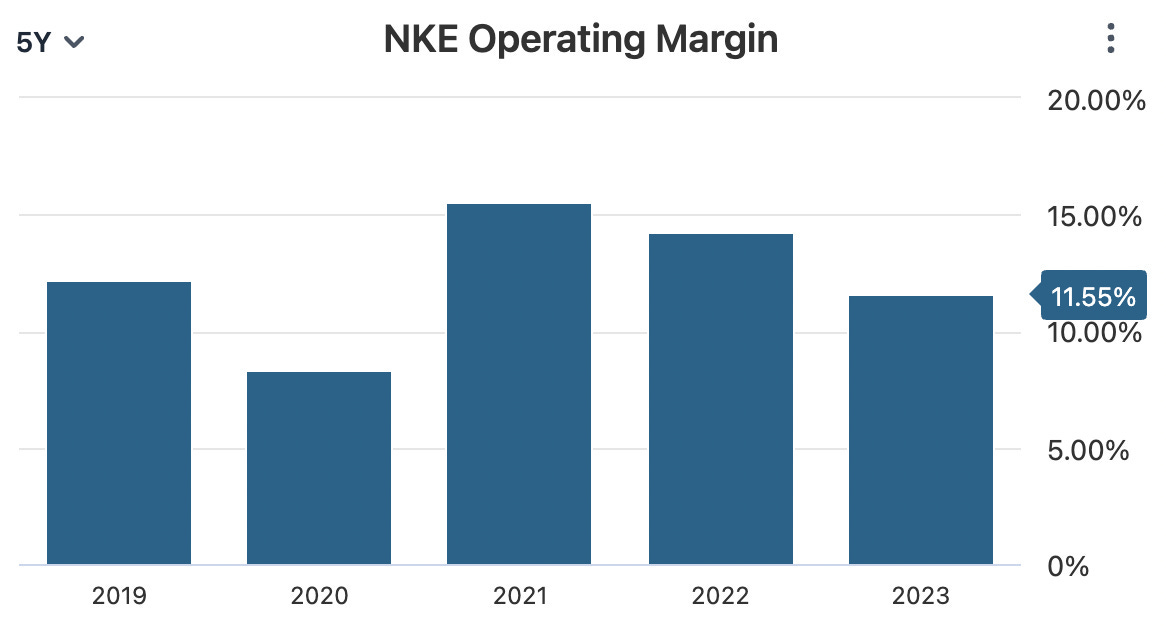
Now let’s look at the broader picture: We have increasing revenue, steady gross margin and declining operating margin.
What does this tell you?
It tells me that the business can’t charge enough premium to cover for its increasing operating expenses so instead it's subsidizing it from its earnings.
Shrinking operating margin doesn’t abruptly cause a bankruptcy of a business like Nike, but it’s not a good thing.
Why would I invest in a business with shrinking operating margin while there are many other opportunities?
I always keep in mind that there is no business I must own to outperform the market.
Return on Equity
If you look plainly at ROE, you will be very glad.
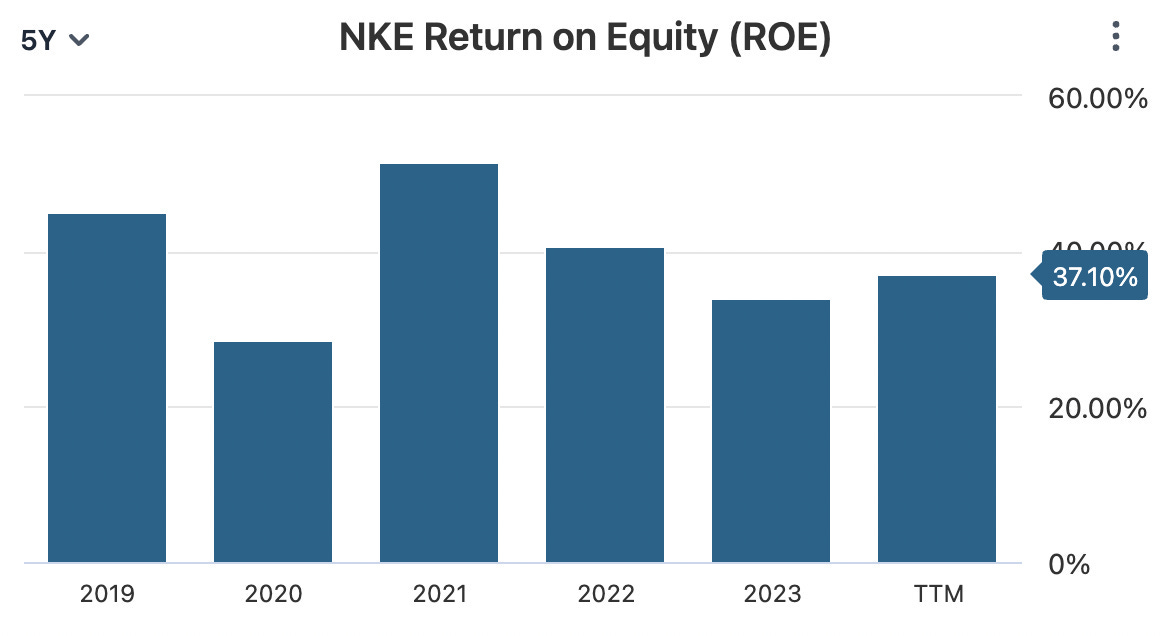
As you see, it consistently generated above 20% return on equity since 2019 despite the recent down trend.
Whenever I see such high ROE’s I also take a look at Return on Assets because the business could actually operate with a small equity pool, in which case ROE will look inflated.
Nike doesn’t surprise me on this. ROA tells a different story.
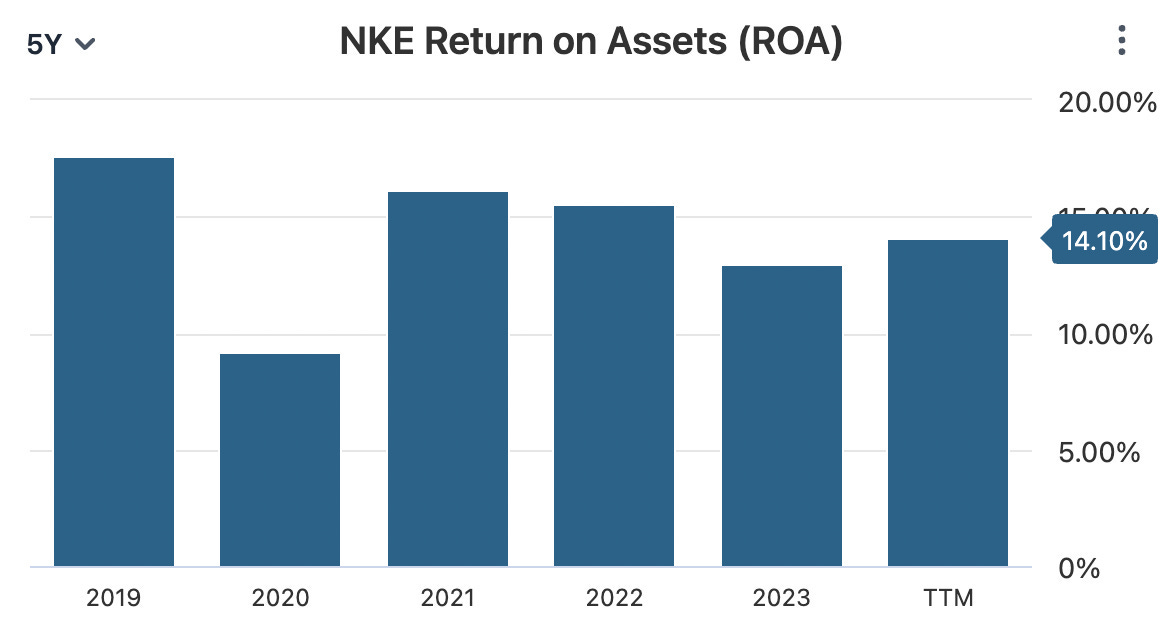
Its average ROA in the last 5 years is actually lower than 15% while its average ROE in the same period is around 25%.
Wider the gap between ROA and ROE, the more skeptical I get about a business' ability to generate returns on its own money.
Though Nike's ROA is still above average of American companies, which is 12%, its ability to generate real returns on its money is nowhere near what ROE suggests.
📈Valuation
If you follow this newsletter, you already know I like being conservative with my valuations.
The reason is simple: In the end, every investment decision should be price dependent. Everything can be a good investment at a cheap enough price and even the most exceptional company can be a bad investment at an expensive price. In this context, I rather have a large margin of safety and mitigate my downside risk than adjusting upward which essentially shrinks my margin of safety and leaves less room to the company for mistakes in execution. If the company exceeds my expectations, it’s wonderful; if it doesn’t, I don’t have much downside.
With Nike, however, my conservative assumption is actually optimistic compared to its recent performance.
I emphasized that Nike still has the most valuable brand in the industry and this won’t change anytime soon. Those lifestyle brands will take market share from Nike but none of them will likely become a big competitor. They will exist in circulation but Nike is here to stay. This is why it will keep generating consistent cash flows even though it won’t likely grow fast.
Plus we have many catalysts ahead for Nike. We just had Euro 2024 and we will also have the Olympics this summer. Many of the most famous athletes will appear in Nike shoes and apparel. On top of all these, we shouldn’t forget that its core audience is also strong and Nike can exercise significant pricing power on them.
Taking into account all those favorable factors, I think Nike can perform a bit better in the next five years than the last five years and deliver 9% average annual revenue growth.
This will give us $79 billion in revenue for FY 2029.
Further, let’s assume that Nike’s profit margin will regress to a 5 year average of 11%. In this case, we will get $8.7 billion net profit.
Attach a conservative P/E of 15, we get a $130.7 billion business. Even if we attach some premium to Nike’s legacy brand status and stable earning power and give it a 20 P/E, we will have $174 billion business.
Nike is currently valued at $110 billion, meaning it offers just 9% annual return even in a very favorable scenario.
What should happen for me to consider Nike as an investment opportunity? Simple, it should promise above market returns, higher than 10%.
I would make my investment decision based on the more conservative one of the two scenarios above and hope for the better one. If we assume that the business will be valued at $130 billion in 2029, I need it to be valued at $80 billion today so I can get at least market return. This will give us a fair value at 14 times earnings. At $3.73 TTM EPS and 14 PE, my buy price would be $52.
I won’t touch the stock unless it comes below $52.
Nike Technical Analysis
My Approach
At My Weekly Stock, we blend in-depth market analysis with proven momentum-based trading strategies. I have developed a proprietary momentum approach that I use to analyze stocks, which relies on three key components:
1. Performance: I like to see stocks trading within 5% of their 1-year high, which indicates strong momentum and minimal resistance. Winning stocks also typically perform better than their peers across multiple timeframes.
2. Trend: I use the 9 and 21 (or 30) exponential moving averages (EMAs) on the daily and weekly charts to assess the trend’s strength. Strong trends typically involve the 9-week EMA being above the 30-week EMA, the stock trading above both EMAs and rising trend lines. I score each stock’s chart out of 5, with a score above 3 suggesting a solid trend.
3. Key Levels: Support and resistance levels are critical technical analysis components, serving as indicators for potential market reversals or continuations. My preferred method is to look for previous highs and lows, any levels where the trend has historically changed, and price gaps.
My approach involves identifying stocks with strong positive momentum and riding their upward trend for as long as possible. While timing the market to perfection is not my goal—since catching the exact highs and lows is more a matter of luck than skill—my experience and research have proven that there is significant profit to be made in the meat of a move.
Nike Momentum Analysis
1. Performance
Nike is down 23% in the past month, 20% in the last quarter, and 32% over the last year. The stock is trading 41% below its 1-year high, indicating a significant drawdown and suggesting strong overhead resistance. Its performance has been lagging behind its sector, industry, and peers.

I used the following benchmarks:
Lululemon (LULU)
Under Armour (UA)
SPDR Retail ETF (XRT)
Consumer Discretionary Sector (XLY)
Analysis was based on the price at the close on Friday, July 12th, 2024.
2. Trend
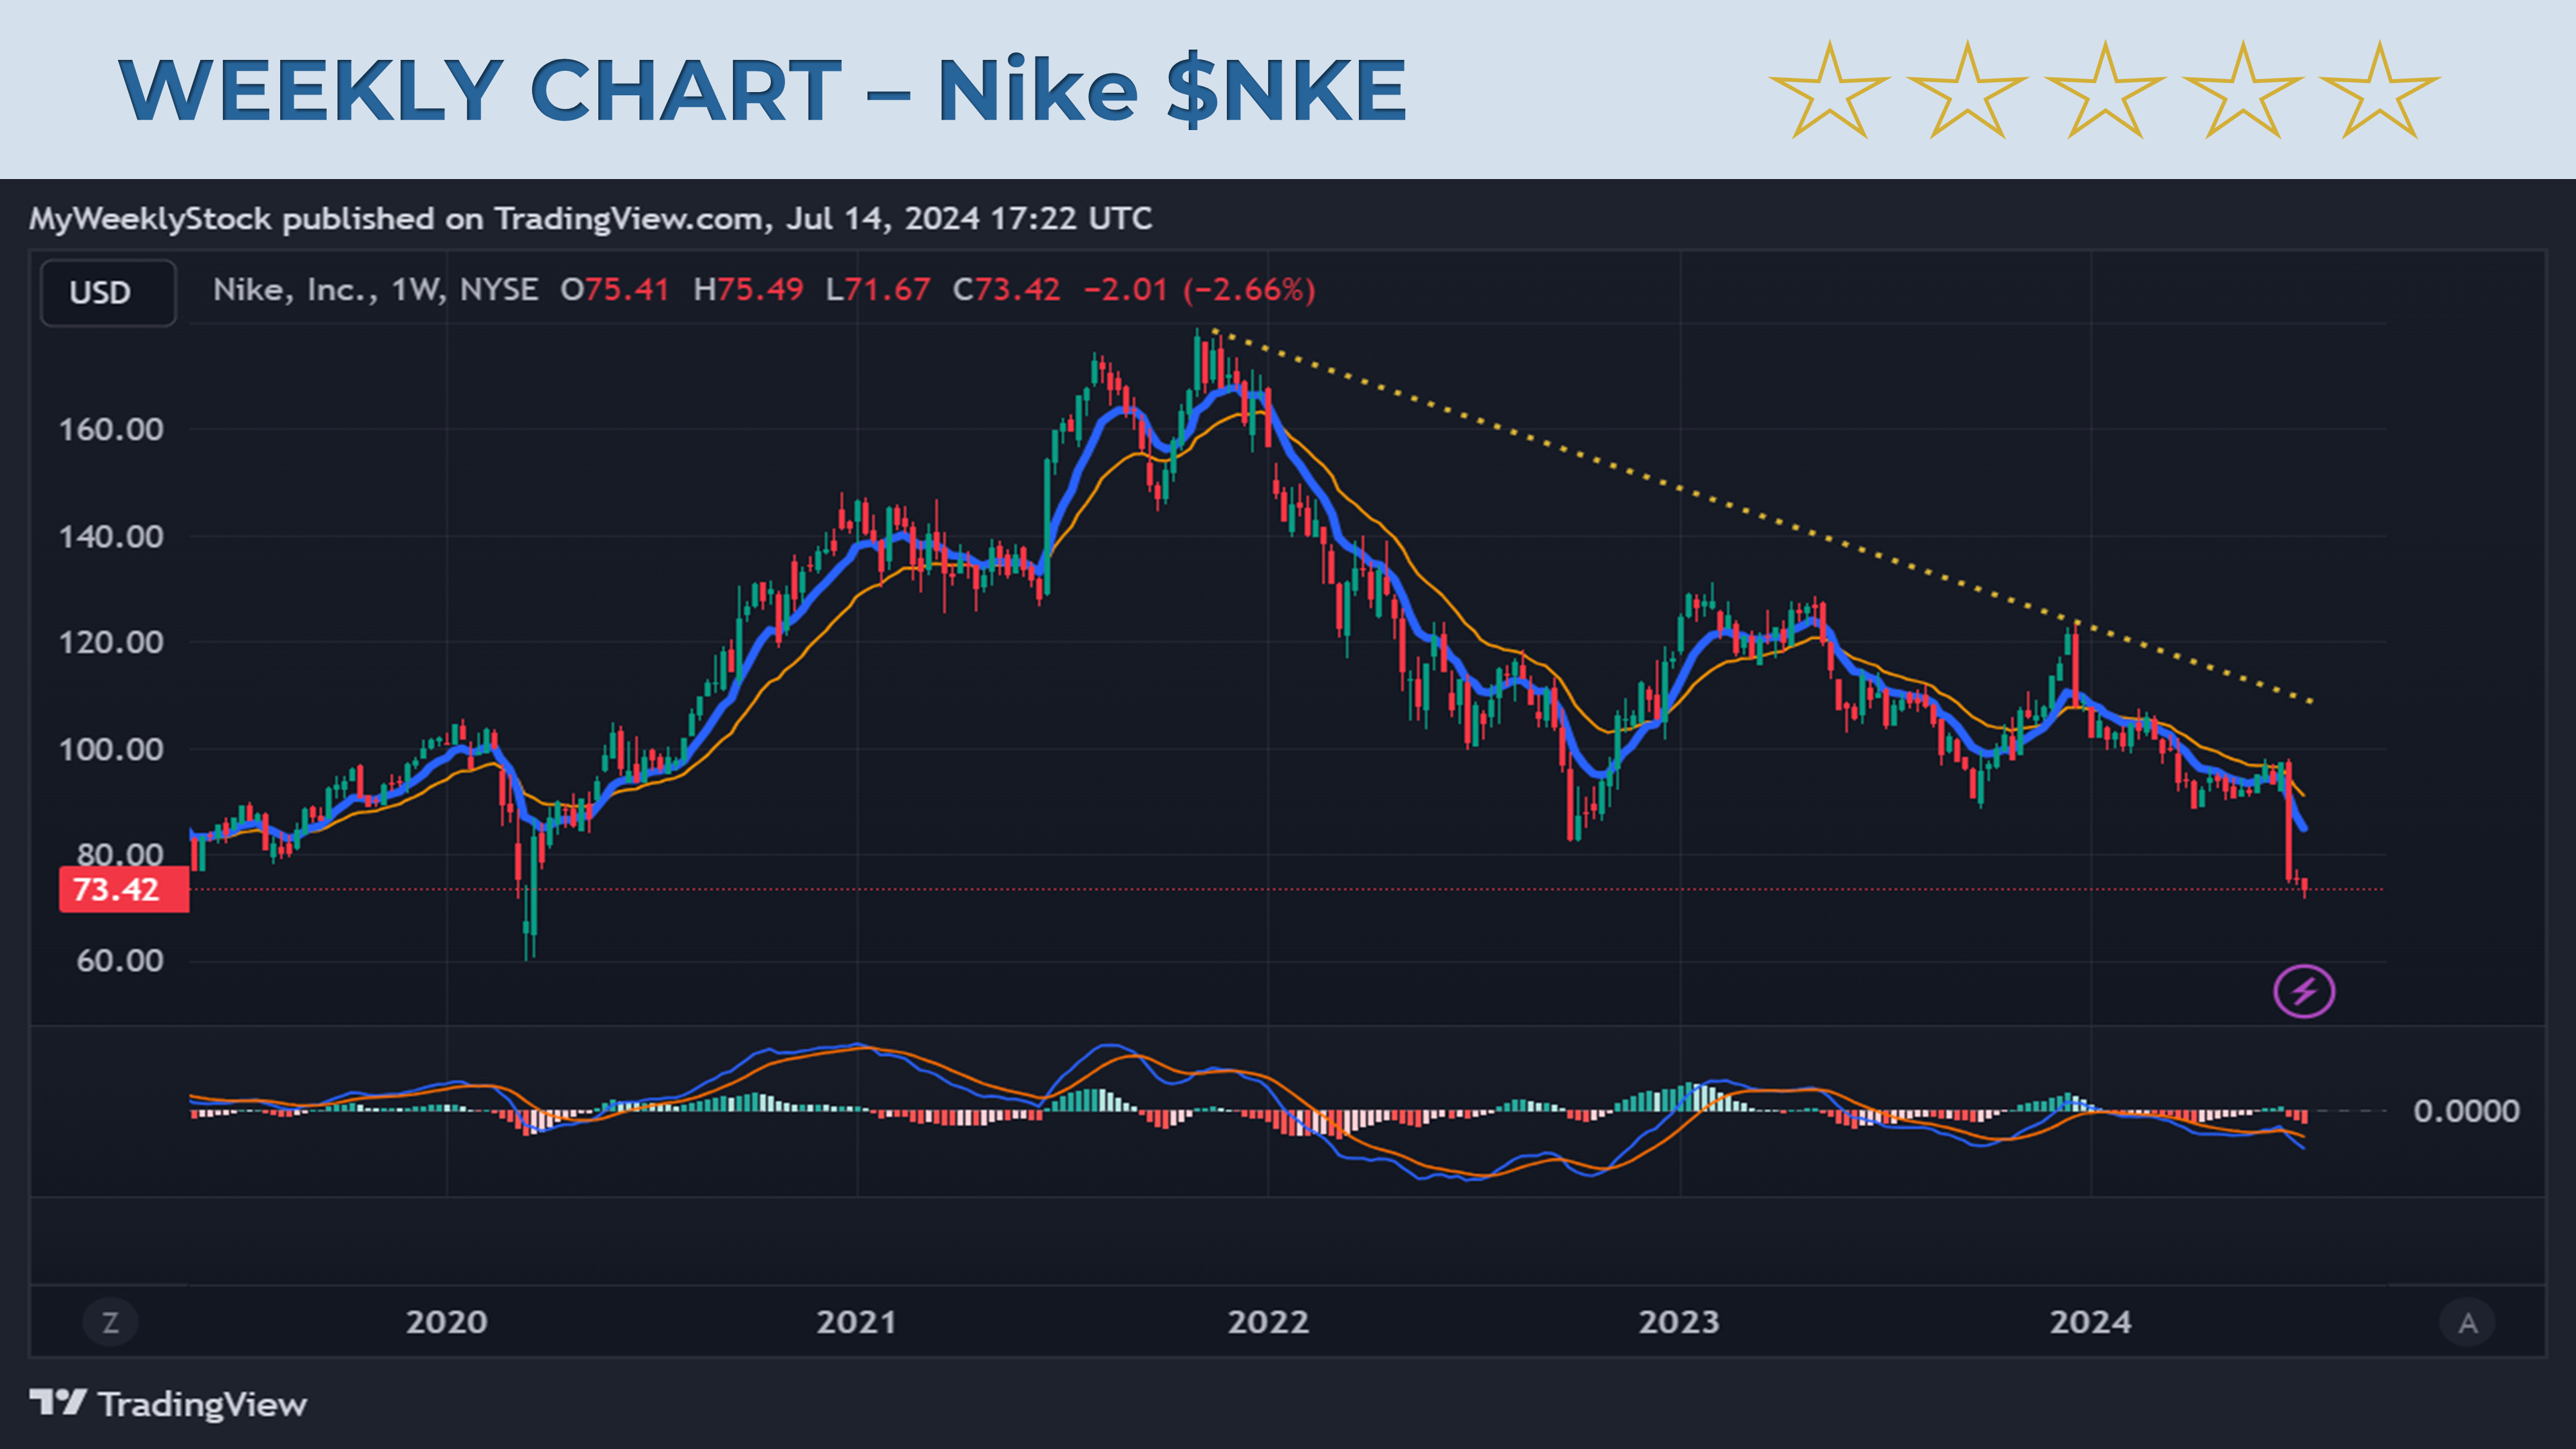
Weekly chart: Weak
Nike’s long-term trend turned negative in early January, and its long-term momentum remains weak. For most of the past three years, Nike has traded below its 30-week exponential moving average, a critical long-term trend line, except for a failed breakout attempt in early 2023.
Daily chart: Weak
Nike is still digesting the disastrous earnings report that led to a 20% one-day selloff. Momentum remains heavily negative, with the stock trading below its 21-day EMA line and with falling moving averages. More concerning is the pattern at play all year: a gap down after reporting disappointing earnings, followed by three months of consolidating in a tight range, and then another gap down on the next earning report. Unfortunately, this pattern is still alive.

3. Key Levels (and % vs. current price)
Support:
$70 (-5%)
$60 (-18%)
$49 (-33%)
Resistance:
$80 (+9%)
$100 (+36%)
$130 (+77%)
Recovering $80 would be a first encouraging sign and allow us to work on closing the gap from the last earnings report. The $100 level is a significant psychological barrier, where we have been ranging for most of the year. The $125-130 area is where rallies have failed in May 2023 and December 2023.
So far, we have held above $70 in terms of support. If this breaks, we must look far back to find good support areas. $60, the COVID lows, is likely one. Below that, $49 is the last line of defense, a level not seen since 2017.
My View: Too Early to Call a Bottom: Nike's 3-Year Downtrend Should Have Taught Us That
Nike has been in a multi-year downtrend since reaching an all-time high in November 2021. All attempts at a breakout have failed, usually at the first resistance level—a sign that often reflects underlying weakness.
Could this turn into a great recovery story? Possibly, but I am skeptical that the bottoming process is over. After significant gap downs following the past three earnings releases, it will likely take several positive earnings reports to rebuild investor and analyst trust. In summary, we have a lot of overhead resistance and many gaps down to fill, making it a likely long recovery process.
Overall, I believe there are better investment opportunities in today's market. Three years of almost continuous downtrend should caution us against trying to predict the exact bottom. Instead, my approach is to wait for clear signs of a positive trend reversal. There will be plenty of profit to make when—and if—the trend shifts positively. For now, we are just too far from that turning point.
🏁Conclusion
A combination of high valuation and expectations, poor earnings reports and guidance, and a long-term stock downtrend typically results in disappointed shareholders. If you bought at the high in 2021, you’d be down 60%, and there is no guarantee it is over.
Ultimately, every investment is price-dependent. Ensuring entry at an attractive price and with a setup that offers a favorable risk-reward profile is our job #1 as investors. Fundamental analysis from Capitalist Letters suggests that even after the recent selloff, Nike shares remain overvalued. Technical analysis from My Weekly Stock indicates it is just too early to call for a bottom.
We aim to provide you with an unbiased, data-driven analysis of Nike. We hope you gain insights into our approach and see how fundamental and technical analysis can complement each other. However, the decision to invest is very personal and depends on many factors. We strongly encourage you to do your own research and share your view on Nike by leaving us a comment on this post!That’s all friends!
That’s all friends, thanks for reading 🙏
If you liked this make sure you subscribe to Capitalist Letters and My Weekly Stock for more posts like this!
Please share your thoughts in the comments below.
👋👋See you in the next issue!
 | A guest post by
|
Thanks for your overview. I prefer $LULU at the moment, added some more positions. Wrote an analysis on them recently - https://longtermpick.com/p/lululemon-analysis
Very good write up. Simple easy to understand how you went about analyzing the company. Great